Why Is My AI Agent So Slow? Find the Bottleneck
Find the real cause of a slow AI agent by measuring first-token, generation, tool, context, queue, and retry latency, then fix the biggest stage.

If an agent takes twenty seconds, the model may be responsible for only part of that wait. The rest can sit in prompt assembly, a retrieval query, a remote API, a second model turn, a retry, or your own response buffer.
I diagnose slow agents as distributed workflows. The first useful question is not “Which model is fastest?” It is “Which stage held the request while the user was waiting?”
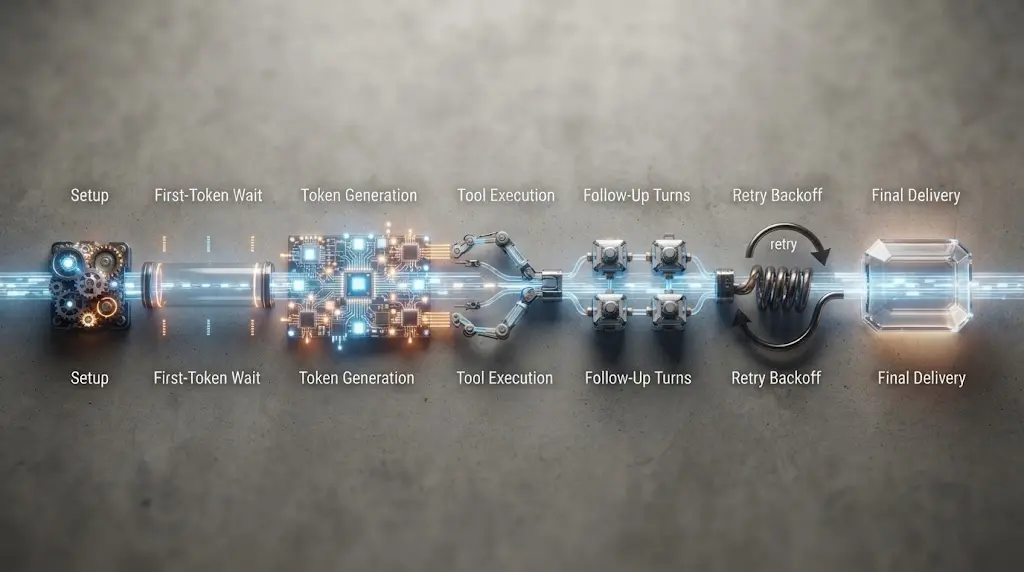
Why is my AI agent so slow?
Your agent is slow because its total response time is the sum of several waits, not one model-speed number. The common contributors are:
- a large prompt or too much retrieved context;
- model reasoning before the first visible token;
- a long generated answer;
- a slow retrieval, database, browser, or business API call;
- several tool calls performed one after another;
- several model turns required to finish one task;
- provider queueing, throttling, or a retry policy;
- application work before the request starts or after the model finishes.
The right fix depends on the shape of the delay. Streaming can help a response feel immediate when the first token is late but the total task time is acceptable. It cannot make a slow database query fast. A smaller model can reduce generation time while making the agent call more tools, ask more clarifying questions, or retry more often. A shorter prompt can lower input work while removing evidence the agent needs.
The Microsoft Foundry latency guide gives a useful model-level formula: total time to the last token equals time to first token plus time between tokens multiplied by the number of generated tokens. It also says latency varies with the model, prompt tokens, generated tokens, and system load (Microsoft Foundry performance and latency). For an agent, extend that idea with tool and orchestration spans:
agent wall time = setup
                + model first-token wait
                + model generation time
                + tool and dependency waits
                + follow-up model turns
                + retries and backoff
                + final delivery
That equation is a diagnosis map, not a promise that every runtime records each stage separately. Your first job is to make the stages visible.
An AI agent is slow when the user-visible wall time grows, but the first repair should target the largest measured stage rather than the most obvious stage.
What does “slow” mean in an AI-agent run?
“Slow” can mean at least four different things. Name the one your user is experiencing before you optimize.
| User complaint | Measurement | What it tells you | First question |
|---|---|---|---|
| Nothing appears for a long time | Time to first token, or TTFT | Setup, queueing, prompt processing, reasoning, or tool preamble may be delaying the first output | Did the request reach the model, and how many input tokens did it carry? |
| Text appears, then arrives slowly | Time between tokens, or TBT | Generation throughput or provider load may be limiting the stream | Did output tokens or reasoning tokens grow? |
| The answer looks finished late | Time to last token, or TTLT | Total model generation, tools, retries, and finalization | Which child span dominates wall time? |
| The task completes much later than the answer | End-to-end workflow time | Background tool work, verification, writes, handoffs, or hidden retries are involved | What counts as completion, and where is that state verified? |
For streaming requests, measure at least TTFT, TBT, generated tokens, and time to last token. For non-streaming requests, measure time to first byte and total request time, while remembering that the user cannot see the model work between those events.
Microsoft’s documentation offers a clean warning: “It doesn't change the time to get all the tokens, but it reduces the time to get first response.” That is the difference between perceived latency and completion latency (Microsoft Foundry performance and latency). Use streaming when early feedback helps, but do not report it as a reduction in total work unless your measurements show one.
The same wall-clock number can also mean different things. A five-second response that produces 2,000 tokens is not the same performance problem as a five-second response that produces 50 tokens. The former may be expected output volume. The latter may point to queueing, a slow first token, a slow tool, or a blocked finalization step.
Time to first token is a user-interface metric, not a complete workflow metric.
The useful comparison is not average latency by itself. Compare the same task shape across a baseline and a change. Keep model, prompt, tools, region, concurrency, and success criteria stable unless the test is explicitly about one of those variables.
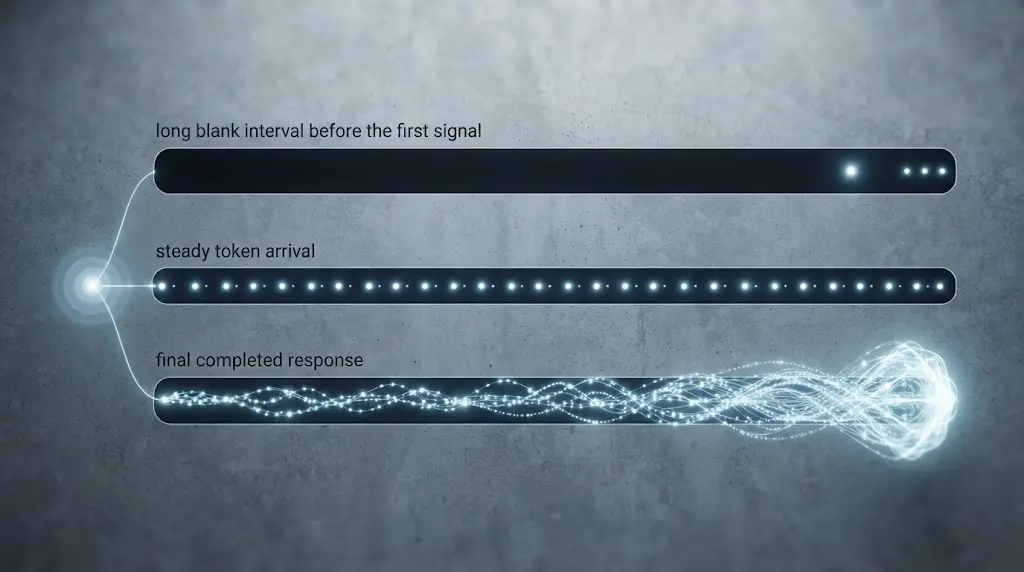
Is the model really slow, or is the wait somewhere else?
Trace one run from the user request to the verified outcome. Put a start and end timestamp around every stage that can wait. You do not need to record the full prompt or tool payload to answer the first question. Names, counts, status, and durations are often enough.
Use this order:
- Record when the application received the user request.
- Record when prompt assembly began and ended.
- Record the model request start, first response chunk, and final chunk.
- Record every tool start, first byte, completion, timeout, and status.
- Record every model turn, handoff, guardrail, and validation step.
- Record retry start, retry reason, backoff duration, and final outcome.
- Record when the interface displayed the first chunk and when the workflow marked the task complete.
The OpenAI Agents SDK makes this stage model explicit. Its runner calls the LLM, executes a tool or handoff when the model produces one, appends the result, and calls the LLM again. Its tracing covers generations, function tools, guardrails, handoffs, and custom events (running agents, tracing). The implementation differs across runtimes, but the diagnostic shape is general: an agent is a tree of waits.
Here is a small hypothetical trace:
| Span | Start | End | Duration | Interpretation |
|---|---|---|---|---|
| request setup | 0.00 s | 0.18 s | 180 ms | Session lookup and prompt assembly |
| model turn 1 TTFT | 0.18 s | 2.10 s | 1.92 s | First model response is late |
| model turn 1 output | 2.10 s | 2.55 s | 450 ms | Short tool selection output |
| search tool | 2.55 s | 4.20 s | 1.65 s | Remote search is the largest single child span |
| model turn 2 TTFT | 4.20 s | 5.60 s | 1.40 s | Second reasoning wait |
| answer generation | 5.60 s | 7.00 s | 1.40 s | 240 generated tokens |
| delivery buffer | 7.00 s | 7.80 s | 800 ms | Server waits before flushing chunks |
| total | 0.00 s | 7.80 s | 7.80 s | User-visible completion |
This agent is not “just a slow model.” It has two model waits, one remote search, and an 800-millisecond delivery problem. Changing the model might help, but flushing the stream and reducing the search wait are earlier hypotheses.
Do not draw broad conclusions from one trace. Use a small set of representative cases: a direct answer, a one-tool task, a multi-tool task, an empty-result task, a slow-dependency task, and a failure that causes a retry. The goal is not a synthetic benchmark with impressive numbers. The goal is to identify whether the same stage keeps owning the delay.
How much latency comes from the model, output, and reasoning?
Model time comes from at least three controllable shapes: the selected model, the work it performs before output, and the amount it generates. Provider defaults and model aliases can change, so pin the model and reasoning configuration in every latency trace.
OpenAI’s current model documentation distinguishes faster, lower-cost variants from larger models and recommends choosing a smaller variant when latency and cost are the priority (OpenAI model selection). That is a useful starting point, not a universal answer. The smallest model may produce worse arguments, omit required evidence, or create extra tool turns. Measure complete task latency and success, not only one API call.
Reasoning settings are another source of wait. OpenAI’s current guidance says reasoning effort controls how much reasoning work a model performs and recommends testing lower settings for latency-sensitive work. It also describes higher-work modes as useful when quality gains justify extra latency and tokens (OpenAI latest-model guidance). The practical rule is simple:
keep reasoning effort as low as the task can safely pass
then raise it only when evaluation shows a meaningful quality gain
Do not ask a high-effort model to perform a low-risk classification, route a request, or format a short status response unless your tests show that the extra work prevents a real failure. Conversely, do not lower reasoning on a task where the resulting errors trigger long repair loops. The slowest successful workflow is the one that produces a fast-looking first answer and then burns time on correction.
Output length is often easier to change than model internals. Set a response shape that matches the task. A tool-selection turn may need a structured call, not a paragraph explaining the decision. A customer-support answer may need two facts and one next action, not a long essay. A research task may require more evidence, so reducing output blindly can make the work incomplete.
Use an output contract that limits accidental verbosity:
{
  "answer": "one concise answer",
  "evidence": ["source-id-1"],
  "next_action": "one allowed next action",
  "needs_review": false
}
Treat the format as a quality contract, not only a speed trick. Check that the contract still contains the evidence and fields your executor needs. If a schema failure causes a retry, a nominally shorter response may increase total latency.
The Azure latency guide notes that generated tokens are produced sequentially and that fewer generated tokens reduce response time. It also recommends considering model choice, maximum generation size, stop sequences, and the number of responses (Microsoft Foundry performance and latency). These are provider-specific settings, but the underlying trade-off is broad: every extra output token creates more decoding work and more bytes to deliver.
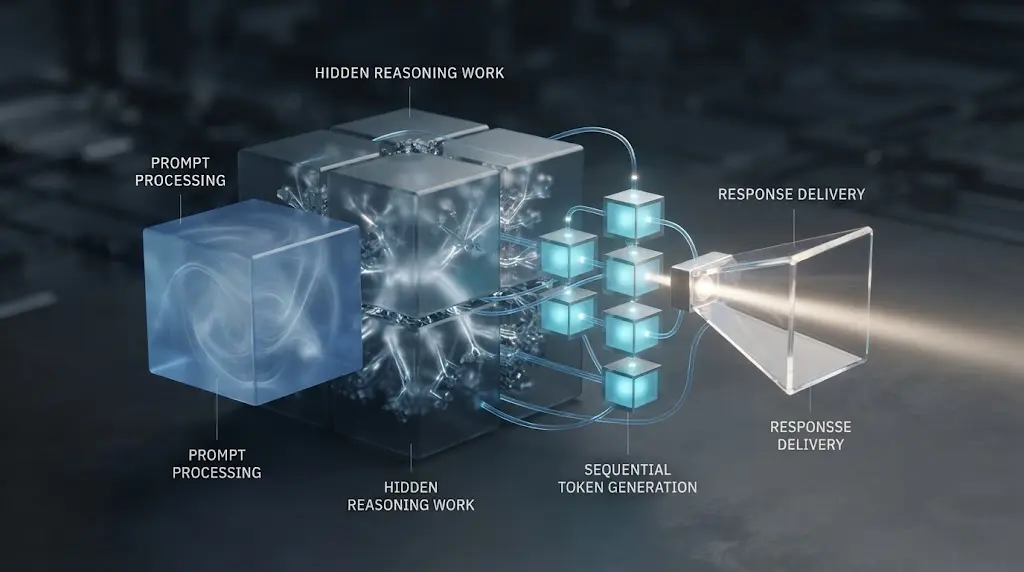
Is my context or tool catalog making each turn slower?
Long context can make the first token slower even when the final answer is short. The model may receive conversation history, retrieved documents, memory records, tool definitions, policy text, and prior tool results before it generates anything. The agent may also pay to serialize and transmit that material before the provider begins processing it.
A prompt can be below the context limit and still be too large for the latency target.
Measure input tokens at the start of every model turn. Separate:
| Input component | Why it grows | Safe first experiment |
|---|---|---|
| system and developer instructions | Repeated rules, examples, or duplicated policy | Remove one repeated block and rerun the same evaluation cases |
| conversation history | Every turn is appended | Keep only task-relevant turns or use a tested summary boundary |
| retrieved context | Too many chunks or low-quality matches | Reduce candidates, deduplicate passages, and preserve source IDs |
| memory | Old preferences or facts are reintroduced every turn | Load only memory relevant to the current task |
| tool definitions | Large descriptions, many overlapping tools, unused schemas | Expose only tools valid for this workflow stage |
| tool results | Raw payloads, HTML, logs, or full records | Return compact structured results with evidence and status |
The separate guide on why an AI agent context window fills up so fast covers context growth as a capacity problem. Here, the key point is narrower: a prompt can be below the context limit and still be too expensive for the latency target.
Prompt caching can help when the same large prefix is reused across many requests. Google Cloud’s current documentation for Claude describes prompt caching as a way to reduce latency and cost for repeated content, while also specifying cache identity, cache-control blocks, and TTL behavior (Google Cloud prompt caching). Caching is not free magic. If the prefix changes on every turn, the cache may not help. If you cache private content, confirm the provider’s data handling and retention rules. If the cached prefix is stale, the agent may act on old instructions or facts.
A useful cache test has three cases:
- a cold request with no reusable prefix;
- a warm request with an identical prefix and a new user question;
- a near-match request where one supposedly stable block changed.
Record cache hit or miss, input tokens, TTFT, total time, and task quality. Do not call caching effective because the bill dropped while TTFT stayed unchanged.
Tool definitions deserve their own inspection. A catalog with twenty overlapping tools may not only complicate selection. It also adds schema material to every relevant turn, and the result of each tool may trigger another model invocation. The wrong-tool diagnosis is the right companion when the selection itself is wrong. For this query, ask a simpler question: which tools were exposed, which one was called, and how much time did the catalog and result add to the turn?
Are sequential tool calls the bottleneck?
Often. A tool-using agent pays for the tool itself, the network path, the dependency’s queue or database work, serialization, and the model turn that decides what to do next. If three independent reads run one after another, the wall-clock time contains all three waits. If they run safely in parallel, the read portion is closer to the slowest branch plus coordination overhead.
The OpenAI Agents SDK documents a runner that executes tool calls and continues the loop, and its current guidance recommends parallelizing independent reads when possible (running agents, latest-model guidance). Do not generalize that into “parallelize all tools.” Writes, approvals, payments, state transitions, and calls with ordering dependencies must remain controlled. Parallel work can also increase load, trigger rate limits, and make partial failures harder to reconcile.
For each tool, record:
- queue time before the request left your process;
- DNS, connection, and TLS time when available;
- remote service time;
- database or downstream API time;
- response parsing and validation time;
- timeout and retry time;
- payload size and result item count.
The tool name alone is not enough. “Search” could mean a fast local index or a browser that waits for a page, JavaScript, and a remote API. “CRM lookup” could mean a cache hit or a cross-region request with multiple joins.
Use a dependency deadline. If the agent has 8 seconds for a user-facing answer, a tool should not silently hold the request for 30 seconds. Pass a deadline or remaining budget to the tool, return a structured timeout result, and let the agent choose a bounded fallback. A timeout should not become an invitation to repeat the same call indefinitely. For loop diagnosis, use the AI agent loop guide, which treats progress and stop conditions as the central problem.
Google Cloud’s current function-calling documentation describes streamed function-call arguments as a way to reduce perceived latency before a function executes, with preview status and model limitations (Google Cloud function calling). That technique can make the tool path feel more responsive, but it does not remove the function’s execution time. Never show partial arguments as if the action already happened. The executor still needs complete, validated arguments and its own authorization check.

Is a queue, rate limit, or retry hiding behind “slow”?
A throttled request can look like a slow model if your application retries silently. The user sees one long wait. Your provider sees an initial request, a 429, a backoff, and another request. Your trace should show all of them.
Azure’s quota documentation says token rate limits use an estimate that includes prompt text, max_tokens, and best_of, and that bursty request patterns can trigger rate limits even when a simple minute-level average looks safe. It also documents response headers such as remaining requests, remaining tokens, reset times, and retry-after-ms (Azure OpenAI quota management). The exact controls differ by provider, but the diagnostic pattern is reusable.
Capture these fields on every provider response:
status_code
request_id
provider_region
model_or_deployment
rate_limit_remaining_requests
rate_limit_remaining_tokens
rate_limit_reset
retry_after_ms
attempt_number
backoff_ms
Retry only errors that are transient in your provider contract. Use a maximum attempt count and a total deadline. Add jitter so a burst of agents does not wake and retry at the same instant. Do not retry a validation error, unauthorized call, malformed tool arguments, or a deterministic context-limit failure as if it were a network blip.
Separate these cases in your dashboard:
| Pattern | Likely cause | Safe next test |
|---|---|---|
| TTFT rises with remaining capacity falling | Queue or capacity pressure | Reduce concurrency for one canary or move the canary to a provisioned or less-loaded deployment |
| 429s appear, then the final response is late | Throttling and backoff | Smooth bursts, reduce estimated token reservations, or request appropriate capacity |
| Model spans are normal but total time has long gaps | Application queue, network, or retry wrapper | Add spans around enqueue, dispatch, backoff, and delivery |
| Only one region or deployment is slow | Routing or regional capacity issue | Compare the same workload in an approved nearby region, respecting data and residency rules |
| Failures occur after output validation | Schema or contract mismatch | Fix the contract or parser; do not add blind retries |
Provider availability is also a real variable. When every trace in a region changes at once, compare your measurements with the provider’s incident and status information. Do not hide a provider regression with a prompt rewrite. A prompt change can make the incident harder to reproduce and may reduce quality after service returns to normal.
How do I diagnose one slow run without guessing?
Use the SLOW test. It is a compact order of operations for the first investigation:
Separate perceived from complete latency
Record first visible output, first useful output, last output, and verified task completion separately. A streaming answer can improve the first number while leaving the last two unchanged.
Locate the first wait
Find the earliest gap that exceeds your expected budget. If the request waits 1.5 seconds before the model call begins, changing the model is the wrong first experiment. If TTFT is high while prompt tokens and queue signals are stable, compare model and reasoning settings. If TTFT is fine but a tool span consumes the wall time, fix the tool path.
Observe token and turn shape
Record input tokens, generated tokens, reasoning tokens where the provider exposes them, number of model turns, tool-call count, handoff count, and retry count. A new prompt may be “faster” only because it stops doing the required work. A smaller model may be “slower” at the task level because it needs more turns.
Work on the largest measured stage
Choose one low-risk change that can affect the largest stage. Rerun the same task set. Keep the change if end-to-end latency improves without a meaningful quality, safety, or completeness regression. Revert or narrow it if the stage moved but the user’s real outcome did not.
This process prevents the most common optimization mistake: selecting a fix because it sounds related to AI rather than because the trace points to it.
Here is the decision table I would put beside the trace:
| Symptom | Confirm with | First experiment | Do not assume |
|---|---|---|---|
| Long blank period before output | TTFT, prompt tokens, queue, reasoning setting | Reduce unnecessary context or compare a lower-effort/faster model on the same cases | The model is always the bottleneck |
| Fast first token, slow stream | TBT, generated tokens, provider load | Reduce output shape or compare a faster model | Streaming fixes total time |
| Long gap after a tool call | Tool span and dependency breakdown | Cache or optimize the dependency, set a deadline, or return a smaller result | The model needs more instructions |
| Many model turns | Turn count and reason for continuation | Make the next action and stop condition explicit, or replace a fixed step with code | More autonomy is always better |
| Slow only under load | p50, p95, concurrency, 429s, remaining capacity | Smooth concurrency and inspect capacity | The median represents the user experience |
| Slow after a model or prompt change | Before and after trace with pinned settings | Revert one variable, then test model, effort, prompt, and tools separately | Faster output means same task quality |
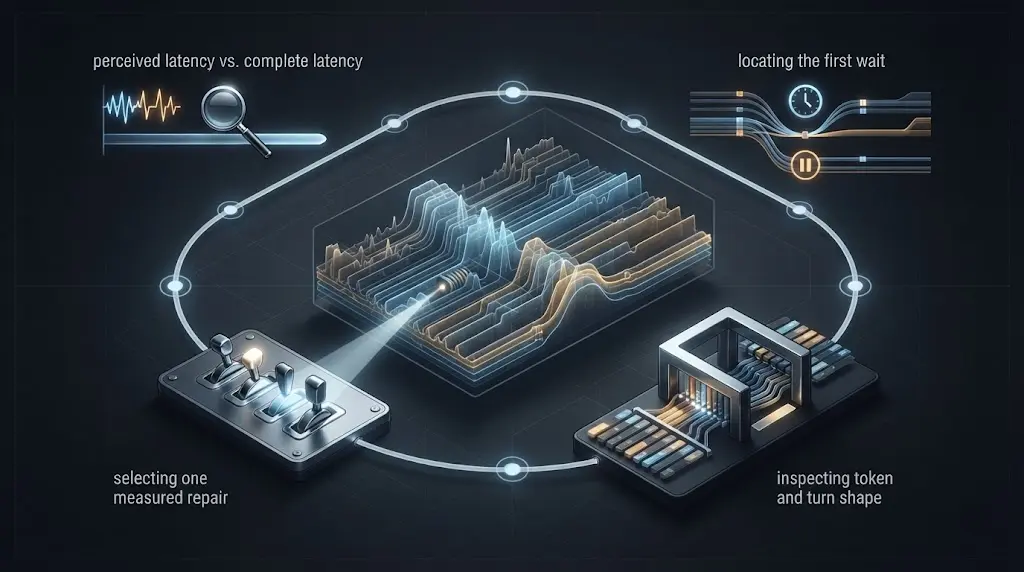
What should I change first?
Change one variable at a time, in this order unless your trace says otherwise:
- Remove accidental work. Stop sending unused tools, duplicated instructions, irrelevant history, raw HTML, and full records that the task does not need.
- Bound the output. Set a task-appropriate response shape, maximum generation size, and stop condition. Check that required evidence and fields remain present.
- Reduce unnecessary turns. Move deterministic formatting, filtering, validation, and simple branching into code. Keep model judgment where the workflow genuinely needs it.
- Improve tool paths. Return compact results, add deadlines, cache safe reads, and parallelize independent reads when their side effects and rate limits allow it.
- Choose a faster model or lower reasoning effort. Run the same representative cases and compare task success, not just token speed.
- Stream earlier. Use streaming for interactive feedback, but continue to measure time to completion.
- Fix capacity and retries. Smooth bursts, use backoff, inspect headers, and stop silent retry chains.
The order is a default. If the trace shows a single tool taking 12 seconds, do not spend an hour trimming a 400-token prompt. If TTFT is 8 seconds on an empty-context direct answer, inspect model, deployment, region, queue, and provider status before touching the tool catalog.
The most important constraint is task success. A response is not faster in any useful sense if it arrives quickly and then causes a human to verify, correct, or redo the work. Track a quality outcome beside every latency change:
keep the change only if
  end-to-end latency improves
  required fields remain valid
  evidence and citations remain sufficient
  safety and authorization checks still pass
  retry and correction work does not increase
That last condition matters for agents. A cheap model that returns invalid tool arguments can add a failed call, a repair turn, and a retry. The API call may have been fast while the workflow became slow.
How should I choose a faster model without breaking the task?
Run a paired comparison. Keep the user task, tool surface, prompt, output contract, and success judge fixed. Compare a current model with one faster or smaller candidate across the same cases.
| Measure | Why it matters |
|---|---|
| task success | A fast wrong answer is not a successful optimization |
| required evidence present | Short answers can omit the proof that makes them usable |
| tool-call validity | A model that emits more malformed calls can create hidden delay |
| TTFT | Shows how quickly useful work begins |
| TBT and output tokens | Shows decode speed and output volume |
| total workflow time | Includes tools, retries, and follow-up turns |
| cost | A lower price can still be expensive if it causes rework |
| tail latency | p95 or p99 exposes the runs that users remember |
OpenAI’s current model pages label variants with different latency and cost profiles and suggest smaller variants for latency-sensitive workloads (OpenAI model selection). That is useful for narrowing candidates. It is not evidence that the smaller model will win your workflow. The workflow includes your prompt, tools, dependencies, traffic shape, and definition of done.
A faster model can make an agent slower when it creates extra turns, retries, or human rework.
Pin model identifiers during the comparison. Aliases and defaults can move. Record the provider, deployment, region, API version, reasoning setting, verbosity or output setting, tool list, and date. If you later change two of those at once, you will not know which change moved the result.
For reasoning models, compare the lowest setting that can pass the task with the next setting up. OpenAI’s current guidance recommends starting from the existing effort when migrating, then testing lower or higher settings against representative evaluations (OpenAI latest-model guidance). Make that test concrete:
candidate A: current model, current reasoning effort
candidate B: current model, one lower reasoning effort
candidate C: faster model, same task contract

accept a candidate only when it passes the quality gate
and its p50 and p95 end-to-end latency improve enough to matter
Do not use a provider’s marketing label such as “fast” as your performance result. Treat it as a candidate description. Your application’s tail latency is the result that matters.
Should I shorten the prompt, cache it, or change the context?
Start by removing work that cannot affect the current decision. Shortening a prompt is not automatically good. The right question is whether each block helps the agent produce a correct, safe, complete next action.
Use a three-column context audit:
| Context block | Decision it supports | Keep, reduce, or remove |
|---|---|---|
| instruction | What behavior or boundary must hold? | Keep once, remove duplicates |
| example | What ambiguity does it resolve? | Keep only examples that fix a measured error |
| history | What current state is needed? | Summarize or expire irrelevant turns |
| retrieval | What evidence is required? | Retrieve fewer, better-scoped records |
| memory | What durable fact changes the decision? | Load only relevant, authorized facts |
| tool schema | What action can be taken? | Expose only the stage’s valid tools |
| tool result | What evidence changes the next step? | Return status, fields, source, and next action |
The context-window page already owned by the site covers the separate problem of context filling up. Link to it for overflow, but keep this article’s latency diagnosis focused on input size, processing time, and relevance.
Use caching when a stable prefix is large and reused often. Google Cloud’s documentation says prompt caching can reduce latency and cost for repeated content, but the requests must match the cache conditions and the cache has a configured lifetime (Google Cloud prompt caching). Treat cache hit rate as a measured field. A cache that hits 5% of the time is not the same optimization as a cache that hits 95% of the time.
Caching also creates correctness and privacy work:
- define which content is stable enough to cache;
- exclude user-specific secrets unless the provider and policy allow it;
- expire instructions and retrieved facts when they become stale;
- record the cache key or a non-sensitive fingerprint;
- compare hit and miss quality, not just duration;
- keep a path that works when the cache is cold or unavailable.
If a prompt is long because it contains tool results, reduce the result before reducing the instruction. A raw API payload is often the wrong boundary. Return a compact object such as:
{
  "status": "found",
  "source": "orders-api",
  "record_id": "redacted",
  "fields": {"state": "shipped", "updated_at": "2026-08-19T08:15:00Z"},
  "next_allowed_action": "answer_user"
}
The sample uses a redacted identifier deliberately. In a real system, apply access control and data-minimization rules before the result enters the model context.
Can parallel tool calls make the agent faster?
Yes, when the calls are independent, read-only or otherwise safely coordinated, and your downstream systems can handle the concurrency. The wall-clock difference is easiest to see in a simple example.
Suppose an agent must read customer status, shipment status, and a policy record. The hypothetical tool durations are 900 ms, 1,400 ms, and 600 ms.
sequential: 900 + 1,400 + 600 = 2,900 ms
parallel:   max(900, 1,400, 600) + coordination = about 1,400 ms plus overhead
The numbers are illustrative, not a benchmark. Parallelism helps only when the calls truly do not depend on one another. If the policy read determines which customer fields are allowed, the safe order is policy first, then authorized reads. If a write depends on a current read, keep that dependency explicit. If two writes can race, use a transaction or a serialized executor rather than hoping the model will reconcile them.
A tool span belongs in the agent's latency budget even when the model generated the tool call instantly.
OpenAI’s current guidance explicitly recommends parallelizing independent reads where possible and says to compare success, completeness, tokens, latency, and cost when changing tool orchestration (OpenAI latest-model guidance). Use that as an implementation prompt, not as permission to run every tool at once.
Parallel work has costs:
- more simultaneous connections;
- higher burst pressure against rate limits;
- partial failure handling;
- larger merged results;
- more complicated cancellation;
- possible loss of ordering or causality.
Return branch IDs and status from each branch. Define what happens when one read times out. The agent should not receive a vague sentence such as “one tool failed.” It needs a structured result that identifies the missing evidence and the allowed next action.

When does streaming help, and when is it a distraction?
Streaming helps when the user benefits from seeing progress before the complete answer is ready. It is especially useful for conversational interfaces where a blank screen makes a two-second response feel broken. It does not help a batch workflow that only consumes the final structured result, and it does not remove the time spent in a slow tool.
Use streaming when:
- the model can produce safe, useful partial output;
- the interface can render chunks without waiting for the full response;
- the server, proxy, and client flush chunks correctly;
- partial output will not be mistaken for a completed side effect;
- you measure both first output and final completion.
Do not stream sensitive intermediate reasoning, secrets, unvalidated tool arguments, or a draft that looks like a confirmed transaction. A user can read “refund issued” before the executor has actually verified and committed that action. The safer pattern is to stream status such as “checking eligibility” and show a confirmed result only after the effect is verified.
Google Cloud documents streamed function-call arguments as a preview capability that can reduce perceived latency before a function runs, but it also describes limitations and the need to handle partial arguments (Google Cloud function calling). This is a good example of why perceived responsiveness and execution completion are separate measurements.
When debugging a streaming path, record:
request_received_at
first_byte_at
first_rendered_chunk_at
first_useful_chunk_at
first_tool_intent_at
tool_started_at
tool_completed_at
last_chunk_at
verified_completion_at
If first_byte_at is early but first_rendered_chunk_at is late, the application or proxy is buffering. If the first tool intent is visible but the tool starts late, your orchestrator or transport is the problem. If the tool starts immediately but completion is late, inspect the dependency.
Streaming improves early feedback only when every layer flushes the stream.
What should my agent latency budget look like?
A latency budget converts “fast enough” into an explicit decision. Set separate budgets for user-visible feedback and verified completion. The budget should reflect the workflow, not an arbitrary round number.
Here is a hypothetical interactive support budget:
| Stage | Budget | Why |
|---|---|---|
| request and session lookup | 150 ms | Keep local work out of the critical path |
| prompt assembly | 250 ms | Fetch only current, relevant context |
| first model response | 1,500 ms | Start showing safe progress |
| policy and order reads | 1,500 ms | Parallel read-only checks |
| final model answer | 1,500 ms | Short answer with cited fields |
| delivery and render | 300 ms | Flush and display chunks |
| total verified completion | 5,200 ms | The actual promise for this workflow |
The numbers are planning values, not a claim about provider performance. Set them from your product promise, current traces, and user tolerance. Then leave a small reserve for variance. Do not allocate every millisecond to the model and discover later that the database, queue, and network have no budget.
For a research agent, a five-second budget may be unrealistic because it has a different job. It might be acceptable to show a progress event within one second and complete a source-backed result within 30 seconds. The correct design can be a fast acknowledgement plus a background workflow, not a heroic attempt to force a multi-source research task into a chat-response budget.
Use percentile targets. A p50 of 3 seconds can hide a p95 of 24 seconds. Record task shape beside the percentile because a direct answer, one-tool lookup, and multi-step research run are not interchangeable populations.
The budget also exposes when an agent is the wrong architecture. If a fixed business rule, a database lookup, or a deterministic transformation occupies most of the critical path, call that code directly. An LLM should not be placed between two deterministic steps merely because the workflow is called an agent.

What does a copy-paste latency contract look like?
Instrument the run with metadata that lets you answer “where did the time go?” without turning production logs into a second copy of user data. The following artifact is a starting point. The field names are my synthesis, not a required provider schema.
{
  "trace_id": "run_redacted",
  "task_shape": "support_order_status",
  "started_at": "2026-08-19T08:15:00.000Z",
  "ended_at": "2026-08-19T08:15:06.240Z",
  "user_visible": {
    "first_byte_ms": 920,
    "first_useful_chunk_ms": 1180,
    "last_chunk_ms": 5920,
    "verified_completion_ms": 6240
  },
  "runtime": {
    "provider": "provider-name",
    "model": "pinned-model-id",
    "region": "approved-region",
    "api_version": "pinned-api-version",
    "reasoning_setting": "pinned-setting",
    "prompt_fingerprint": "sha256:redacted",
    "input_tokens": 1240,
    "output_tokens": 180,
    "reasoning_tokens": null,
    "cache": {"status": "hit", "key_fingerprint": "sha256:redacted"}
  },
  "spans": [
    {"kind": "setup", "name": "prompt_assembly", "duration_ms": 180, "status": "ok"},
    {"kind": "generation", "name": "model_turn_1", "ttft_ms": 740, "tbt_ms": 18, "output_tokens": 24, "status": "ok"},
    {"kind": "tool", "name": "order_lookup", "duration_ms": 860, "status": "ok", "result_items": 1},
    {"kind": "tool", "name": "policy_lookup", "duration_ms": 540, "status": "ok", "result_items": 1},
    {"kind": "generation", "name": "model_turn_2", "ttft_ms": 710, "tbt_ms": 15, "output_tokens": 156, "status": "ok"}
  ],
  "retries": [],
  "limits": {
    "deadline_ms": 8000,
    "max_turns": 3,
    "max_tool_calls": 4
  },
  "outcome": {
    "task_success": true,
    "required_evidence_present": true,
    "side_effect_verified": true
  }
}
The important properties are not the exact names. They are the boundaries:
- a trace that joins all spans for one task;
- timestamps that split user-visible and verified completion;
- model and configuration fields that make comparisons fair;
- token counts that explain generation work;
- tool durations and statuses;
- retries and backoff rather than a single collapsed duration;
- explicit limits;
- a quality outcome beside the speed outcome.
OpenAI’s tracing documentation describes traces as end-to-end operations made of spans and lists generation, function, guardrail, handoff, and custom spans (OpenAI Agents SDK tracing). OpenTelemetry’s GenAI semantic-conventions repository is another useful reference for evolving span conventions (OpenTelemetry GenAI agent spans). Do not claim that this JSON is an OpenTelemetry payload. Map it to your tracing system after your own privacy and cardinality review.
Keep sensitive data out by default. Record lengths, hashes, IDs that cannot identify a person, status codes, and redacted error classes. If you temporarily capture prompts or tool payloads for debugging, set an expiry, restrict access, and delete them when the incident is understood. A latency investigation does not justify indefinite retention of customer content.
How do I test a latency fix honestly?
Use a small, repeatable test set with a success definition. You do not need a grand benchmark. You need enough cases to expose the shape of the workflow.
| Case | What it isolates | Example success condition |
|---|---|---|
| direct answer | baseline model and delivery | correct concise response with no tool call |
| one fast read | one tool span | correct answer cites the returned record |
| three independent reads | orchestration and parallelism | all required evidence present, no unauthorized merge |
| slow dependency | deadline and fallback | bounded response or clear escalation before deadline |
| empty result | branch handling | no invented result, explicit not-found state |
| validation failure | retry classification | one bounded repair or controlled failure |
| high context | prompt processing and caching | quality preserved with measured TTFT change |
| concurrent load | queueing and rate limits | p95 stays within budget and 429 handling is visible |
Run the baseline and candidate on the same cases. Randomize order when practical so a provider’s changing load does not line up with only one candidate. Record at least five repetitions per case if the workflow is cheap enough, and more for a noisy production dependency. If you cannot run a real test, label the proposed values and conclusions as a plan, not as results.
Do not report only the fastest run. Use median and tail values, then inspect individual traces. A p95 regression on a high-value task can matter more than a small p50 improvement on a common direct answer.
The acceptance record can be as simple as:
candidate:
  model: pinned-model-id
  reasoning: low
  prompt_revision: 2026-08-19-a
  tool_plan: parallel-read-v2

quality:
  task_success: pass
  evidence: pass
  safety: pass
  schema_validity: pass

latency:
  ttft_p50_ms: record
  ttft_p95_ms: record
  total_p50_ms: record
  total_p95_ms: record
  retries_per_run: record

decision: keep only if the quality gate passes and the target percentile improves
That last sentence protects against optimization theater. A change that reduces output tokens but increases retries is not a win. A change that improves p50 but breaks p95 on a critical tool is not automatically a win. A change that improves latency and lowers evidence quality needs a product decision, not a green chart.
What failure modes fool teams into fixing the wrong thing?
Slow-agent incidents often come with a misleading story. The following patterns are common enough to check early.
| Misleading story | What may actually be happening | Better diagnosis |
|---|---|---|
| “The model got slower.” | Prompt size grew, reasoning effort changed, or output doubled | Compare pinned config, input tokens, output tokens, TTFT, and TBT |
| “Streaming is broken.” | The server buffers chunks or the UI waits for a full sentence | Compare provider first byte, server flush, client render, and first useful chunk |
| “The search tool is slow.” | Search is quick but HTML parsing, reranking, or a second fetch is slow | Trace the tool into child operations |
| “The agent needs a smarter prompt.” | A dependency times out and the model retries it | Inspect status, retry reason, and backoff before changing instructions |
| “The smaller model is faster.” | It produces more turns or invalid calls | Compare total workflow time and tool-call validity |
| “The context window is full.” | It is below the limit but carries irrelevant history on every turn | Measure input tokens and context relevance |
| “Parallelism fixed it.” | The test had favorable load or fewer retries | Compare the same task set, error rate, and dependency pressure |
| “The provider is fine.” | Your queue or proxy holds the request before dispatch | Add local enqueue and dispatch timestamps |
| “The average is acceptable.” | A small set of p95 or p99 runs are unusable | Segment by task shape and inspect tail traces |
The cure is boring but effective: preserve a baseline trace, change one important variable, and rerun the same task class. Keep a note of what the change was supposed to affect. If it affects a different span, you learned something even if the user-visible result did not improve.
When should I stop optimizing the agent and simplify it?
Stop optimizing the agent when the trace shows that the model adds little value to the critical path. A fixed workflow is often better when:
- the next step is determined by a small set of explicit rules;
- the data source and output schema are known;
- the task does not benefit from open-ended planning;
- most latency comes from deterministic tools;
- the agent spends turns explaining or reformatting instead of deciding;
- a human already reviews every action;
- the workflow cannot meet its deadline without hiding work or skipping verification.
The existing when to use an AI agent decision framework covers that architectural choice. The latency test here supplies evidence for the choice. If a direct API call plus a fixed formatter completes the task in one second and the agent takes seven seconds without improving the outcome, the faster system is also easier to test and operate.
An agent can still be useful around the fixed path. Let it classify an ambiguous request, select among a small set of workflows, or prepare a draft for approval. Keep deterministic retrieval, authorization, writes, and verification outside the model where practical.
This is not an argument for removing model judgment everywhere. It is an argument for putting model judgment where it earns its wait.

What should I do today if my AI agent is slow?
Start with one trace, one budget, and one controlled change.
The 30-minute triage
- Pick a slow run that represents a real user task. Do not choose only the most dramatic incident.
- Record the run ID, task shape, model, region, reasoning setting, prompt revision, tool catalog revision, and date.
- Add timestamps for request receipt, model dispatch, first chunk, each tool, each model turn, retry, last chunk, and verified completion.
- Add input tokens, output tokens, tool count, turn count, status codes, and backoff duration.
- Sort the spans by wall time. Identify the largest stage and the largest gap between stages.
- Pick one change that directly affects that stage.
- Rerun the same task set and check quality, safety, completeness, p50, p95, and retries.
The repair checklist
- [ ] Is first output late, or is only final completion late?
- [ ] Did prompt tokens, retrieved chunks, tool schemas, or history grow?
- [ ] Did generated tokens or reasoning tokens grow?
- [ ] Did the model or deployment alias change?
- [ ] Did a tool, database, browser, or external API dominate the trace?
- [ ] Are independent reads being serialized?
- [ ] Are writes, approvals, and side effects still ordered and authorized?
- [ ] Did a 429 or timeout trigger hidden backoff?
- [ ] Is the proxy or client buffering streamed chunks?
- [ ] Is the task actually a fixed workflow that does not need an agent?
Do not make ten changes and call the result an optimization. You will have no causal explanation, and the next provider or prompt change will erase the lesson.
What is the practical answer to a slow AI agent?
Measure the agent as a workflow, not as a single model call. Split the run into first-token wait, token generation, tool and dependency spans, follow-up turns, retries, queueing, and delivery. Then reduce the largest measured wait while preserving task success and verified outcomes.
The fastest useful agent is not the one with the fastest model label. It is the one that does less unnecessary work, exposes only the tools it needs, runs safe independent reads together, stops when the task is complete, and gives the user honest progress while the remaining work finishes.
If the trace says the model is the bottleneck, compare model and reasoning settings. If it says the context is the bottleneck, remove irrelevant material or test caching. If it says tools are the bottleneck, fix the dependency or change the orchestration. If it says retries are the bottleneck, fix the error contract and deadline. If it says the agent adds no useful judgment, simplify the workflow.
That is the decision. Find the wait. Prove it. Change one thing.

Questions people ask next
What is the fastest way to find why an AI agent is slow?
Trace one complete run and split wall time into setup, time to first token, token generation, tool calls, follow-up model turns, retries, and final delivery. Compare the slow run with a fast run using the same task shape. Fix the largest measured stage first.
Does streaming make an AI agent faster?
Streaming usually improves perceived speed by showing the first response chunk earlier. It does not necessarily reduce the time needed to generate the complete answer. Measure both time to first token and time to last token before calling it a performance fix.
Can a long prompt make an AI agent slow?
Yes. A larger prompt can increase time to first token and can also make the agent process more history, retrieved material, and tool definitions than the task needs. Measure input tokens and remove or summarize context only when the quality and safety checks still pass.
Why do tool calls make an AI agent slow?
A tool adds its own network, queue, database, or vendor latency. Sequential tools add their waits one after another, and each completed tool may trigger another model turn. Record each tool span, parallelize independent read-only work when safe, and keep side effects ordered.
Should I switch to a smaller model to speed up my AI agent?
Possibly, but test the smaller or faster model on representative tasks. Compare success, required evidence, output quality, time to first token, total latency, tokens, and cost. A faster model that causes rework or extra retries may make the whole workflow slower.
How do rate limits create slow AI-agent responses?
A burst can trigger throttling, a 429 response, and a retry delay. Record status codes, retry-after values, remaining request or token capacity, and backoff time. Smooth concurrency and retry only transient failures instead of treating every slow run as model latency.